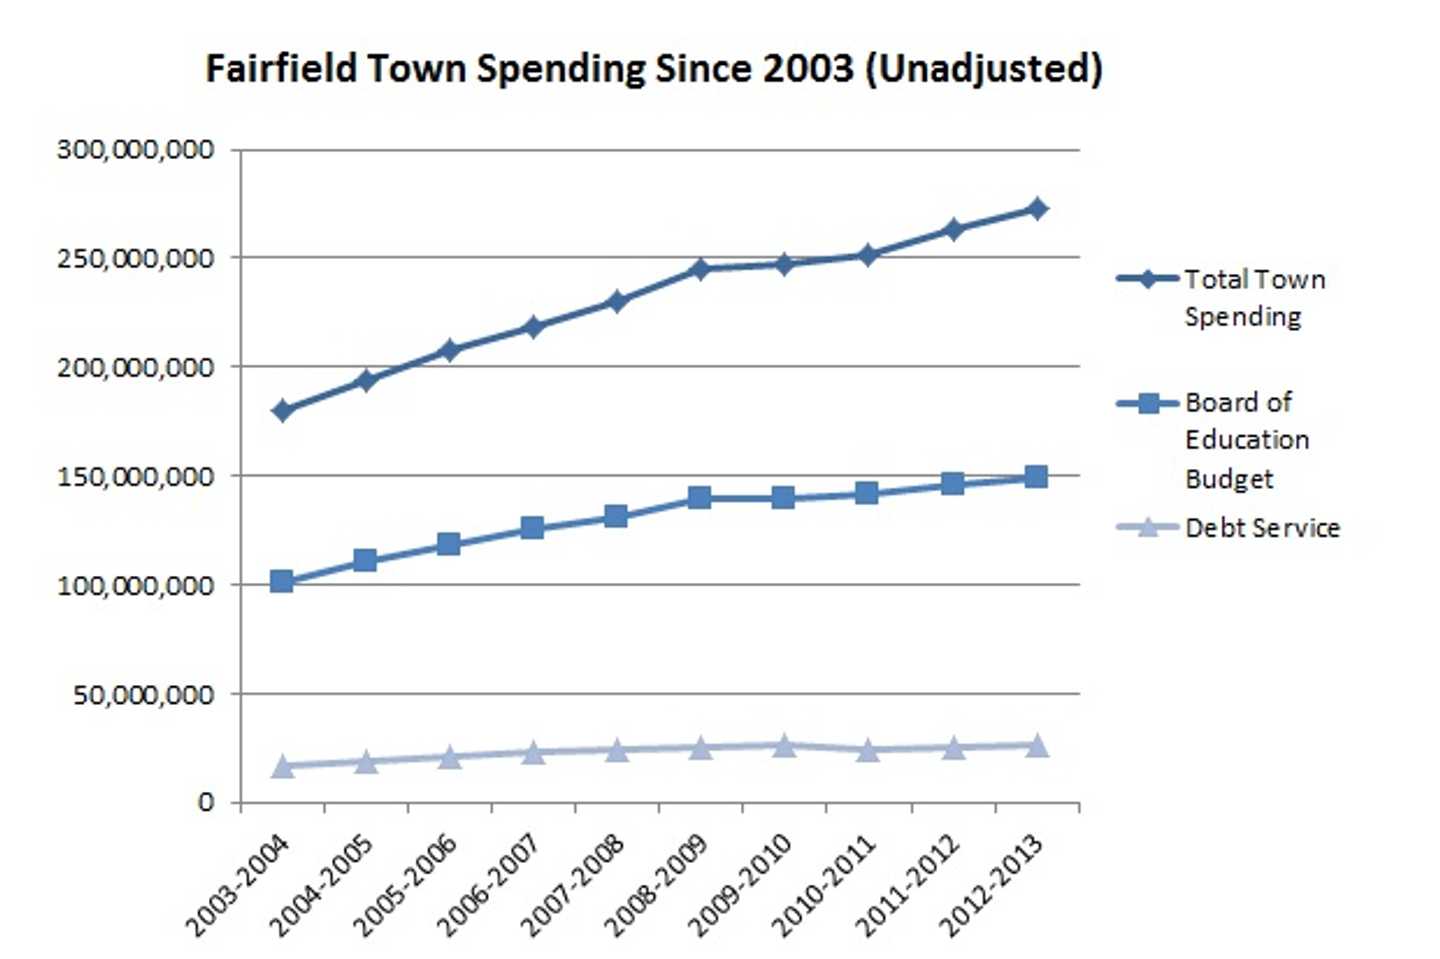


But there’s more at work in the budget than this 60 percent increase in the bottom line. Nationwide inflation means that the $179 million the town spent in the 2004 fiscal year wouldn’t go as far in 2014. A rising town population, especially among school-age children, means the town and the Board of Education must provide services to more citizens.
The Fairfield Daily Voice crunched some of these numbers to provide a better picture on how the town government’s spending has changed over the past decade. We’ve also included some comparisons to the two towns in Fairfield County closest to Fairfield in population: Greenwich and Stratford.
In terms of inflation, the value of the U.S. dollar has fallen about 25 percent since 2003, according to the Bureau of Labor Statistics. That means that it would take about $1.25 to have the same buying power as $1 in 2003.
Another measure of inflation is the Consumer Price Index, which tracks the comparative prices goods in specific areas over time. The Tri-State Area’s CPI rose 27.5 percent from July 2003 (when the 2003-04 budget was adopted) to last July, according to the Bureau of Labor Statistics.
With inflation taken into account, Tetreau’s proposal for 2013-14 is about $62.63 million more than the 2003-04 budget would have been in 2013 dollars. That means that Fairfield’s spending grew by about 27.9 percent in real value over the decade.
Fairfield’s population was 59,404 as of 2010, according to the U.S. Census Bureau, an increase of about 3.6 percent since 2000. The proposed 2013-14 budget would spend about $4,836.54 per resident. Adjusted for inflation, that would be an increase of 26.7 percent in per-capita spending from 10 years ago.
For comparison, Greenwich’s per-capita spending in the current fiscal year is $6,109.70, which marks a 13.3 percent inflation-adjusted increase since 2003. Stratford will spend about $3,714.42 per person this year, just 4.3 percent more than it did in the 2003-04 fiscal year. The state government’s per-capita spending this year will be $5,747.74, an 18.9 percent increase from 2003.
But Fairfield’s population hasn’t just grown, it’s gotten younger. Fairfield Public Schools have seen districtwide enrollment rise by more than 1,600 students since the 2003-04 school year, or 18.7 percent. As a result, Fairfield has had to spend more on its schools.
The Board of Education’s funding for the current school year is $148,936,464, a 47.7 percent increase over the last 10 years without accounting for enrollments or inflation. In 2003-04, Fairfield Public Schools spent $11,615 per pupil, or $14,536 in today’s dollars. For the 2012-13 school year, Fairfield’s per-pupil funding rate is $14,452, about $84 less.
For comparison, this year Greenwich will spend $15,819 per student for the 8,838 pupils in its public schools, according to the Greenwich Board of Education’s 2012-13 budget. Stratford’s current schools budget allots $12,559 for each of its 7,484 students.
Fairfieders’ ability to pay has risen in the last decade as well. In 2000, Fairfield’s median household income was $83,512, according to the U.S. Census Bureau. In today’s dollars that would be $111,679. By the 2010 census, that figure had grown to $118,476, or $125,117 when adjusted for inflation. That’s an increase of $13,438, or 12 percent.
The portion of the budget that most taxpayers notice is the mill rate, or the number used to calculate tax bills each July. Fairfield’s mill rate has changed just 8.7 percent since 2003, going from 21.5 mills in July 2003 to 23.37 last July. But property values have risen with other costs, so tax bills have gone up even more.
For example, in mid-2003 the average home in Fairfield’s 06430 ZIP code (now 06824) sold for $670,700, according to the Greater Fairfield County MLS. A home appraised at that value would have paid a tax bill of $10,094 in taxes in July 2003. The average sales price in the same ZIP code was $781,400 in 2010, the year of the most recent property revaluation. A house with that value would have paid $12,783 in property taxes last summer.
Based on that estimate, Fairfield’s average tax bill rose 26.6 percent in the last 10 years. But when adjusting for inflation, the change was about $150, or about 1.2 percent.
See Fairfield's 2013-14 proposed budget in full detail at the town's website.
CORRECTION: This story originally contained a typographical error regarding one of Fairfield's zip codes.
Click here to follow Daily Voice Fairfield and receive free news updates.